I was hoping to learn more from the random square data of the Tafila-Busayra survey than I actually have. The material culture provides little more than a verification of the general trends in the number of sites by period. The geographic distribution of the random squares across the three “zones” (gorges, plateau, and desert) that MacDonald distinguishes, however, might add a qualitative nuance to the purely quantitative analysis of the major sites I’ve been working on.
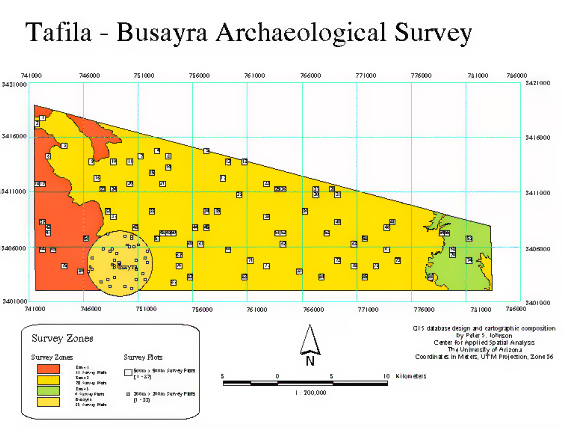
From Burton MacDonald, Tafila-Busayra Archaeological Survey, Phase 2 Report
11 of the random squares were located in the gorge region, 70 in the central plateau, and 6 in the desert region to the east. Of the 11 located in the gorges, only 6 had a gentle enough slope to be properly surveyed. When you break down the random squares by geography and which periods of material culture are represented, it’s clear that most of the random squares containing material culture for any period were located on the plateau:
This, however, is a bit deceptive considering how many of the random squares are located on the plateau in the first place. Looking at the percent of the random squares within a zone that contain material culture for each period allows for a slightly less skewed comparison, but it’s still a distortion:
Byzantine material culture occupies the largest percentage of squares within all three of the regions. Perhaps more interesting is the way the distribution shifts in the Early-Medieval through Early Modern periods. Both the very percentage of Early Medieval presence in the random squares on the plateau and the fact this is the only period for which the random squares with material culture on the plateau don’t significantly outnumber those in the other zones would suggest that something strange is going on. My first impulse is to attribute this to the difficulty of distinguishing Byzantine and Early Medieval potsherds, which MacDonald implicitly acknowledges in his periodization. The exclusive presence of Late Medieval material culture on the plateau, on the other hand, makes more sense.
I’ve been reluctant to map the random square data, but I think maps would allow a comparison of the presence of material culture within random squares across periods. This chart prompts two related questions:
- Where does one see “continuity” rather than “change”?
- Is there continuity within zones, and for which cultural transitions?.